
PPO Write-Off Rates and Equipment ROI: Why Your Insurance Strategy Affects Every Capital Decision
Jun 30, 2026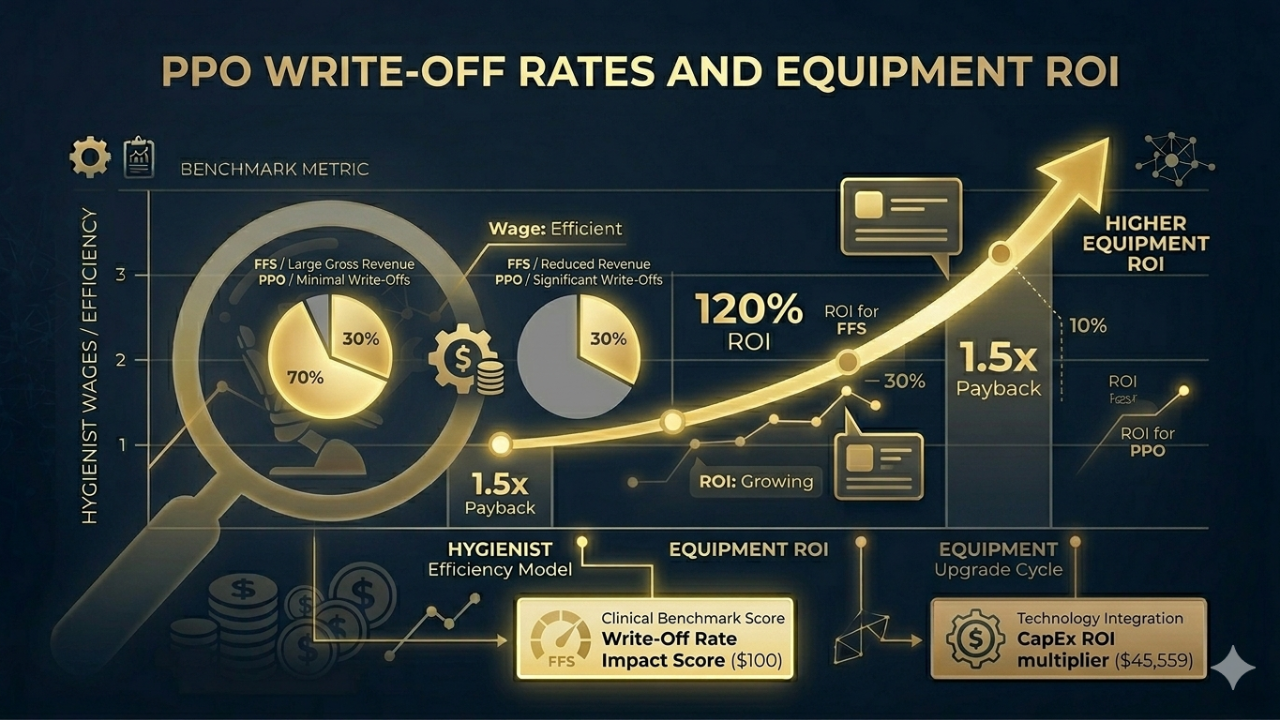
The relationship between PPO write-off rates and equipment investment decisions is one of the least discussed but most consequential dynamics in dental practice finance.
Here's the core tension: PPO write-off rates determine effective revenue per procedure. Effective revenue per procedure determines what new equipment investment can be justified. A practice writing off 42% of its PPO production is operating with dramatically compressed margins relative to an FFS or low-write-off practice — and that compression affects every capital expenditure decision the practice makes.
The Write-Off Rate Benchmark — Where Practices Actually Stand
The DSI Benchmark Index tracks PPO write-off rate (D2) as a core metric. National distribution for GP practices:
| Percentile | PPO Write-Off Rate | |---|---| | P10 | 15% | | P25 | 22% | | P50 (median) | 30% | | P75 | 38% | | P90 | 46%+ |
The top quartile of practices on this metric — those below 22% write-off — have either very selective PPO participation, successfully renegotiated fees, or a higher FFS mix that dilutes their overall write-off rate.
How Write-Off Rate Affects Equipment ROI Calculations
Every equipment ROI calculation in dentistry involves revenue assumptions. Those assumptions are very different at a 20% write-off rate vs. a 40% write-off rate.
Example: Intraoral scanner ROI
A practice considering an intraoral scanner (approximately $35,000–$55,000 depending on system) typically models the return as:
- Reduced per-case lab cost ($60–$120/case savings vs. PVS impression + model)
- Eliminated remakes (1–3% of cases)
- New procedure capability (digital denture workflows, implant scanning, etc.)
At a 25% PPO write-off rate, the lab savings accrue at close to full value because the practice is collecting ~75 cents on the dollar from PPO procedures. At a 42% write-off rate, the savings are the same but the practice's overall revenue per procedure is compressed — which means the payback period on the scanner is longer and the opportunity cost of the capital is higher.
The compressor replacement example
A compressor replacement ($8,000–$18,000 depending on system and location count) is a necessity, not an efficiency investment — but the timing decision involves the same capital allocation question. A practice with compressed margins from high write-off rates may defer necessary equipment replacement in ways that create downstream risk: higher maintenance costs, unexpected downtime, and patient experience issues that affect retention.
Payor Mix as a Capital Planning Variable
Payor mix — the split between FFS, PPO, and Medicaid (metrics D1a, D1b, D1c) — is typically treated as an insurance strategy question. It's also a capital planning variable.
Why it matters for equipment investment:
FFS patients generate more revenue per procedure than PPO patients at the same fee schedule, because there's no contractual write-off. A practice that successfully transitions 10 percentage points of its production from PPO to FFS — say, from 70% PPO to 60% PPO — generates meaningfully more revenue from the same procedure volume.
That revenue improvement flows directly into equipment investment capacity. DSI Benchmark data shows that practices in the top quartile on payor mix (lowest PPO concentration, highest FFS share) tend to have newer equipment fleets — not because they're better managed, but because they have more margin to reinvest in the practice.
The DSI PPO Profitability Analyzer models the revenue impact of PPO mix changes — including the drop-scenario model showing what happens to production if you exit a specific plan. This is the financial case that informs whether a practice can afford equipment investment in the near term.
The AR Connection: Collections Quality and Equipment Financing
AR quality benchmarks (A6: AR days outstanding, A7: AR over 90 days) also connect to equipment investment in a practical way: lenders look at collections quality when underwriting equipment financing.
A practice with 55 AR days outstanding and 32% of AR aged over 90 days has weaker cash conversion than a practice with 28 AR days and 8% in the 90+ bucket. The former will typically face higher rates or more restrictive terms on equipment financing — which raises the effective cost of capital for equipment purchases.
Improving AR quality before a major equipment purchase isn't just good practice management. It's pre-loan preparation.
Using the PPO Analyzer Before a Capital Investment
Before committing to a significant equipment purchase, consider running the DSI PPO Profitability Analyzer as part of the financial case. It will show you:
- Your current effective reimbursement rate across your PPO plans
- Which plans are the worst performers on write-off rate
- The revenue impact of dropping your lowest-performing plan, including the portion of those patients likely to stay at FFS rates
- Where your payor mix sits relative to peer practices
A practice that identifies a single plan it can credibly exit — recovering $40,000–$60,000 in annual revenue from patients who stay at FFS rates — has just identified the financing source for a significant equipment investment.
Common Questions
How do I find my write-off rate by plan? Your PMS Insurance Analysis or Carrier Analysis report breaks adjustments by payor. Divide contractual adjustments by gross production for each plan. In Dentrix: Reports → Management → Insurance Carrier Summary. In Eaglesoft: Reports → Insurance → Carrier Analysis.
What write-off rate should I target before a major equipment investment? There's no universal threshold, but below the P50 (30%) puts you in favorable territory for equipment ROI math. Above P75 (38%) means every equipment investment needs to be evaluated with compressed margin assumptions.
Does the DSI PPO Analyzer show per-plan data? Yes — you enter contractual adjustments for your top three plans separately, and the analyzer computes per-plan effective reimbursement rates and the drop-scenario model for each.
Related Reading
- What DSO Buyers Are Looking at Beyond EBITDA
- How Your Dental Overhead Ratio Affects Your Acquisition Offer
- What Your Equipment Age Is Doing to Your Practice Health Score
- DSO CAPEX Planning: A Data-Driven Framework
Find out what your PPO write-off rate is costing you — and what you could recover.
The DSI PPO Profitability Analyzer calculates your write-off rate by plan, your payor mix percentile, and the drop-scenario revenue impact. Free, anonymous, under 5 minutes.