How Your Dental Overhead Ratio Affects Your Acquisition Offer — and How Benchmarks Change the Conversation
Jun 23, 2026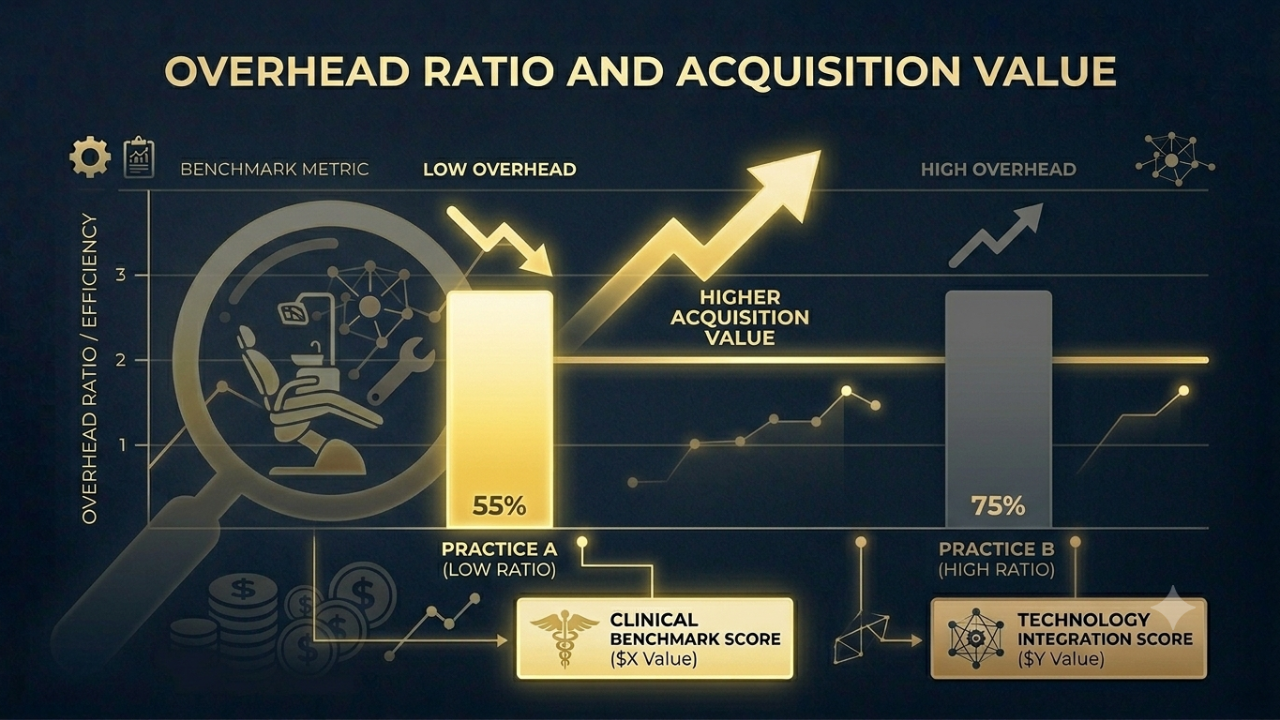
A dental practice's overhead ratio is one of the first numbers a buyer, lender, or PE firm looks at when evaluating a potential acquisition. It's also one of the most commonly misread numbers in practice finance.
The problem isn't that practice owners don't know their overhead percentage. Most do, roughly. The problem is they don't know what it means — which components are driving it, whether their mix is typical for their practice type and size, and whether the number signals a problem or reflects a deliberate operational decision.
That's what independent benchmark data solves.
Why Overhead Ratio Matters in Dental M&A
In a practice acquisition, overhead ratio affects value in two ways:
Directly, through EBITDA: Lower overhead ratio = higher EBITDA margin = higher enterprise value at a given multiple. A practice collecting $2M at 55% overhead generates roughly $400,000+ in doctor-comp-adjusted EBITDA. The same practice at 65% overhead generates roughly $200,000 less — which at a 7x multiple is a $1.4M difference in enterprise value.
Indirectly, through risk assessment: An overhead ratio above the P75 for the practice's peer group signals either a structural cost problem or a near-term management opportunity, depending on the cause. Buyers who see above-benchmark overhead without a clear explanation apply a risk premium to the deal — which means a lower multiple or a harder negotiation.
The Six Components Buyers Decompose
When a DSO or PE buyer looks at overhead, they don't stop at the aggregate. They go line by line. Here's what they find and what benchmarks say about each:
Staff Cost Ratio (the biggest line)
Total non-doctor payroll + benefits ÷ collections. This is typically 55–65% of total overhead in most dental practices, making it the single most important component.
Benchmark: P50 is approximately 26–28%. Above 33% signals either overstaffing, above-market wages, or high benefits cost — all of which a buyer will investigate.
Why it matters for equipment investors: High staff cost ratio often correlates with practices that have underinvested in technology that creates efficiency (digital workflows, intraoral scanners that reduce lab cases, CAD/CAM that eliminates return visits). Equipment investment and labor efficiency are connected.
Occupancy Ratio
Rent + utilities + CAM ÷ collections. Fixed and hard to change — which is exactly why buyers care about it.
Benchmark: P50 is 6–7%. Above 10% in a high-cost market may be unavoidable. Above 10% in a mid-market city is a problem — especially with a long lease remaining.
In acquisitions: A lease at above-market rates with 8+ years remaining is explicitly modeled as a liability. Some DSO buyers require lease renegotiation as a condition of close.
Clinical Supplies Ratio
Supplies ÷ collections. Benchmark: P50 is 5–6%. Above 8% almost always means no centralized purchasing discipline.
DSOs drive this to 4–5% through GPO agreements and centralized ordering. An independent practice at 9% supplies ratio has a clear improvement opportunity that a DSO buyer will model as post-acquisition upside — which means they capture the benefit, not the seller.
Lab Ratio
Outside lab ÷ collections. Benchmark: P50 is 7–8% for GP practices, but highly case-mix dependent.
The equipment angle: Practices with in-house CAD/CAM (CEREC, Planmeca, etc.) typically run lab ratios of 3–5% vs. 8–12% for fully-referred practices. The equipment investment pays back in lab cost reduction — and shows up in this benchmark metric.
Marketing Ratio
Marketing ÷ collections. Benchmark: P50 is 2–3%. Above 6% without commensurate new patient volume is a conversion problem, not a marketing problem.
Average Operatory Equipment Age (F5)
The equipment age metric discussed in our companion post. It directly affects the capex adjustment in acquisition modeling — and it's now tracked in the DSI Benchmark Index as an overhead domain metric.
How the DSI Overhead Benchmark Is Used Pre-Sale
The most sophisticated practice sellers we work with are now running DSI Benchmark scorecards 12–18 months before going to market. Here's why:
Identifying negotiating leverage: A practice in the top quartile on overhead benchmarks has documented evidence that it's operationally efficient — evidence that holds up in diligence better than seller assertions.
Identifying fixable problems: Above-benchmark supplies or lab ratios are often fixable in 6–12 months with supplier negotiation and purchasing discipline. Fixing them before market improves EBITDA margin and thus the offer.
Establishing a performance trend: Multiple quarters of DSI data showing overhead improvement is a stronger story than a single snapshot.
Equipment timing decisions: When the Overhead Analyzer flags that your equipment age is in the bottom quartile, it triggers the replacement math: does proactive replacement before sale generate more in reduced capex adjustment than it costs to finance?
Common Questions
What overhead ratio should I target before going to market? Below P50 for your practice type and size is the right goal. For a 4–6 operatory GP practice, that's approximately 57–60% or below. The DSI Benchmark segments by practice type and size, so the comparison is apples-to-apples.
Does the overhead ratio include doctor compensation? No — and this is critical for comparability. DSI excludes doctor compensation, as do most sophisticated buyers and quality-of-earnings analysts. A sole-owner GP and a DSO-employed associate have very different doctor comp structures; including it makes the ratio incomparable.
My overhead is high because I've been investing in new equipment. Is that a problem? Heavy recent equipment investment will temporarily increase overhead through depreciation and financing costs. This is worth noting explicitly when presenting financials to a buyer — and the DentalAssetIQ equipment inventory can document exactly what was purchased and when, making the story clear.
Related Reading
- What Your Equipment Age Is Doing to Your Practice Health Score
- DSO CAPEX Planning: A Data-Driven Framework for Equipment Replacement
- Dental Equipment Depreciation vs. Market Value: Why They Go in Opposite Directions
- What DSO Buyers Are Looking at Beyond EBITDA
See exactly where your overhead sits relative to peer practices.
The DSI Overhead Analyzer benchmarks all six cost categories — including your equipment age — against the national practice distribution. Free, anonymous, under 5 minutes.
