What Your Equipment Age Is Doing to Your Practice Health Score (And Your Valuation)
Jun 16, 2026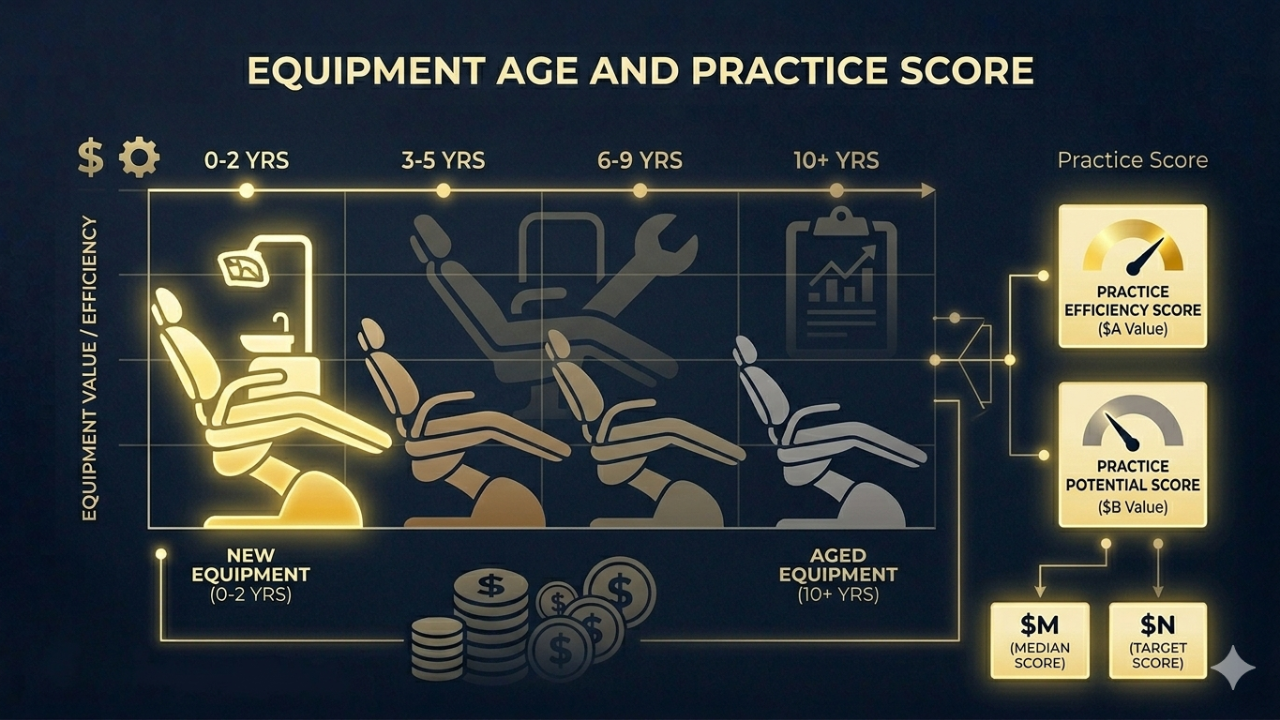
When a dental practice goes to market — whether for a DSO acquisition, an associate buyout, or a bank-financed transition — equipment age shows up in the deal in two places.
The first is the obvious one: the physical inspection. A buyer walks the ops, notes the chair model and vintage, checks the compressor room, and mentally starts building a capex adjustment.
The second is less visible but increasingly common: the operational benchmark score. As the DSI Benchmark Index expands, average operatory equipment age (metric F5) is now a scored component of the Overhead & Facility domain — weighted into the DSI Practice Health Score that practice owners, advisors, and eventually institutional buyers will use to evaluate operational quality.
Here's what both of those mean in practice.
How Equipment Age Scores in the DSI Benchmark
The DSI Benchmark Index tracks average operatory equipment age — mean years across chairs and delivery units in active clinical use — as part of the F domain (Overhead & Facility). Direction is lower-is-better: a practice with newer equipment scores higher than one with aging chairs, all else equal.
Why it's included as a benchmark metric:
Equipment age is a proxy for three things that directly affect practice value:
- Maintenance cost drag — Older equipment generates disproportionately higher repair costs. A chair over 12 years old typically costs 2–3x as much annually in service calls as one under 5 years old.
- Near-term capex obligation — Equipment aging toward end of life represents a liability that sophisticated buyers price into their offers.
- Patient experience and case acceptance — Dated operatory aesthetics and equipment reliability issues affect patient confidence and, measurably, case acceptance rates.
The benchmark distribution (national, GP practices):
- P25 (newer fleet): Under 6 years average age
- P50 (median): 8–10 years
- P75: 12–14 years
- P90 (aging fleet): 15+ years average
If your chairs average 14+ years, you're in the bottom quartile on this metric — and it will show in your Overhead Analyzer results.
What Equipment Age Does to a DSO Acquisition Offer
Here's the part most practice owners don't fully understand until they're in a letter of intent.
DSOs and PE-backed groups don't just buy EBITDA. They buy EBITDA net of near-term capex requirements. An offer that looks like 7x EBITDA on the surface may effectively be 6.2x after a $180,000 equipment capex adjustment — split across four operatories with chairs averaging 16 years old.
The adjustment methodology varies by buyer, but the most common approach:
Expected remaining useful life: If a chair has a useful life of 15 years and is currently 13 years old, the buyer assigns 2 years of remaining life and budgets full replacement cost within the hold period.
Replacement cost vs. fair market value: The capex adjustment is based on replacement cost (what it will cost to put in new equipment), not fair market value of existing equipment. These are very different numbers. A 14-year-old DCI Edge chair might carry fair market value of $2,500–$4,000. Replacing it with a current chair-and-delivery-unit package runs $18,000–$28,000. The buyer is thinking about the latter.
What this means for sellers: Every year of additional equipment age past the P75 benchmark (~12–14 years) is not neutral — it's actively reducing your net offer.
The Overhead Analyzer Connection
The DSI Overhead Analyzer captures average operatory equipment age as one of its ten inputs and benchmarks it against the national distribution. This is the fastest way to see where your equipment age sits relative to peer practices — and what it means for your Overhead & Facility domain score.
If your equipment ages are putting you in the P75–P90 range, that's a signal worth acting on before you go to market. The math on proactive replacement vs. buyer capex adjustment often favors replacement — particularly if you can finance the replacement at practice rates and depreciate the cost before sale.
The rough math:
- 4 operatories × $22,000 average chair/unit replacement = $88,000 investment
- Financed over 60 months at practice equipment rates: ~$1,700/month
- Expected reduction in buyer capex adjustment: $80,000–$100,000
- Expected improvement in EBITDA multiple applied to that adjustment: 0.5–1.0x EBITDA uplift in net proceeds
It doesn't always pencil. But it's worth running the numbers — which is exactly what the Overhead Analyzer is designed to help you do.
Common Questions
Does equipment age affect practice value even for non-DSO sales? Yes. Associate buyouts, bank-financed transitions, and broker-facilitated practice sales all involve some form of equipment assessment. Banks financing SBA practice loans look at equipment age as part of collateral quality. Associates and their advisors factor capex burden into their offer price and financing ask.
What's the difference between equipment age and equipment condition? Age is a proxy; condition is the actual driver. A well-maintained 12-year-old chair in excellent condition may score better in a physical inspection than a neglected 7-year-old chair. However, for benchmark scoring purposes, age is the objectively measurable metric — condition requires an in-person appraisal. DentalAssetIQ provides both.
At what age should I seriously consider proactive replacement before a sale? As a rule of thumb: if your chairs will average more than 12 years old at the anticipated time of sale, run the replacement math. If they'll be under 8, the buyer impact is minimal.
Related Reading
- Dental Equipment Valuation for Practice Sales: What Buyers Actually Look At
- The Hidden Liability in Every Dental Practice Sale: Equipment No One Has Actually Valued
- How Long Does Dental Equipment Actually Last? Lifespan Benchmarks by Category
- Repair vs. Replace: The Dental Equipment Decision Framework
- Building the Operational Infrastructure That Scales
See where your equipment age sits in the national benchmark.
The DSI Overhead Analyzer benchmarks your average operatory equipment age alongside five other overhead metrics — giving you a complete Overhead & Facility domain score relative to peer practices.
Run Your Free Overhead Analysis at DSI Benchmark →
Free. Takes under 5 minutes. Ten inputs from your P&L and practice profile.
